Research brief
Takeaway: Visual-first text analytics turns visualisation from end-stage output into the start of analysis. Software maps a large text's themes and how topics recur over time, and researchers interpret and adjust those relationships rather than hand-coding them. This can reveal subtle patterns and make concept lists reproducible.
Why this matters
- What was known
- Established qualitative analysis software helps researchers code and organise text, but the workflow stays textual and visuals are mostly used to display the researcher's themes at the end.
researchers do the work of metaphorically handling the text to create themes for discussion
(§1, p. 3) - What this paper adds
- A practical introduction to two tools from the University of Queensland, one for themes and one for conversation over time. They are demonstrated on a single TV interview and set against the hand-coding workflow of established qualitative analysis software.
Leximancer and Discursis highlight a visual approach to analysis which changes the way text is used as evidence and forms the basis for decision-making
(§1, p. 3) - Who it matters to
- Social researchers and discourse analysts working with large text data-sets, across very different fields.
Such motifs would allow researchers from very disparate fields to find patterns of relevance, both expected and unexpected.
(§4, p. 6)
Research question
- How do Leximancer and Discursis work, how should researchers work with them, and how are visual concepts relevant to all stages of their use in analytic decision-making?
Method and data
- Design
- Methods report introducing two visual text analytic software tools developed at the University of Queensland, with a worked example.
- Setting
- Example analyses of a transcript of the ABC Enough Rope Programme (aired 4 October 2004), a conversation between host Andrew Denton and Prof. Peter Singer.
- Analysis
- Leximancer for thematic analysis (concept maps). Discursis for sequential analysis (conceptual recurrence across turns), both based on word frequency statistics.
Findings
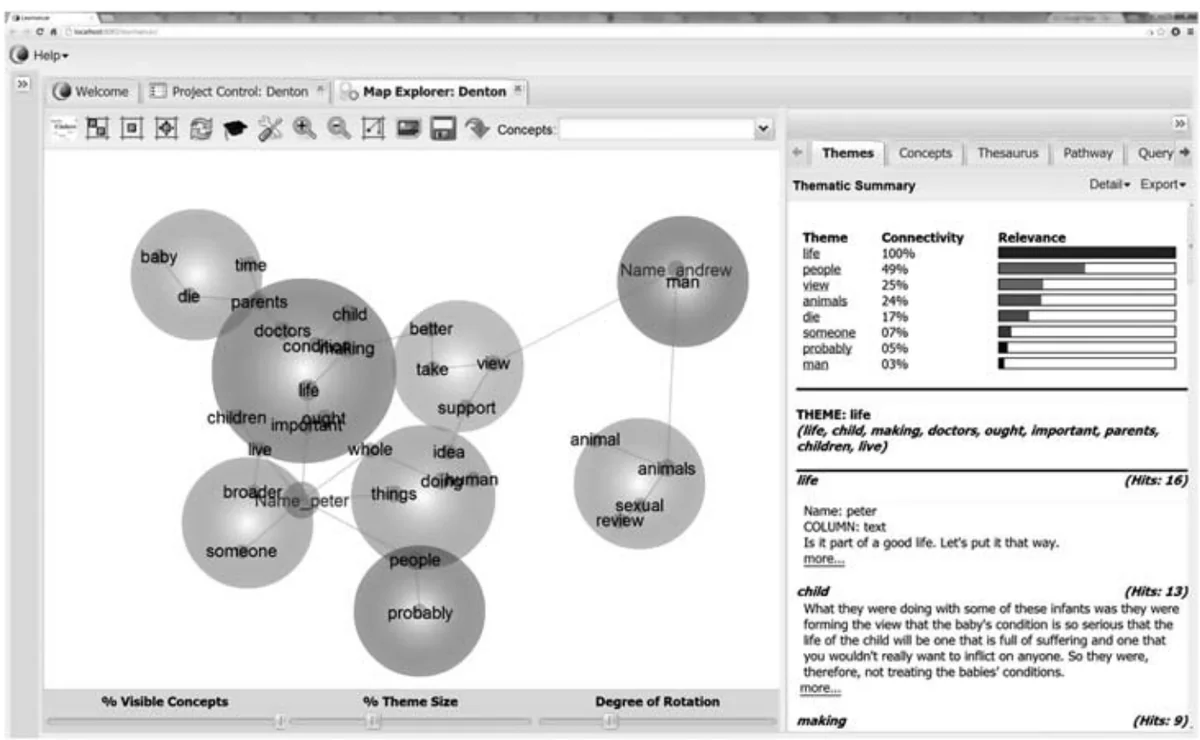
Two tools, two jobs. Leximancer and Discursis do complementary jobs. Leximancer finds the main topics in a text, how they relate and who uses them, while Discursis shows how topics are used over time, where they change and where they recur. #
(Abstract, p. 2)From building themes to interpreting them. Because both tools generate the relationships in a text automatically, the researcher's task shifts from defining relationships, as in hand-coding, to making sense of the ones displayed, and then splitting, combining and refining them. #
“Critically, this is a process of adjusting the software's automation rather than a process of manual arrangement using software.”
Automatic concept lists are reproducible. Leximancer builds its own concept list from the text, instead of asking analysts to design lists of codes, and subtle or unusual relationships may be more likely to emerge. The comparison with manual coding: #
“the list is statistically reliable and reproducible, being generated from the input text itself, whereas manual lists require checks for coding reliability and validity”
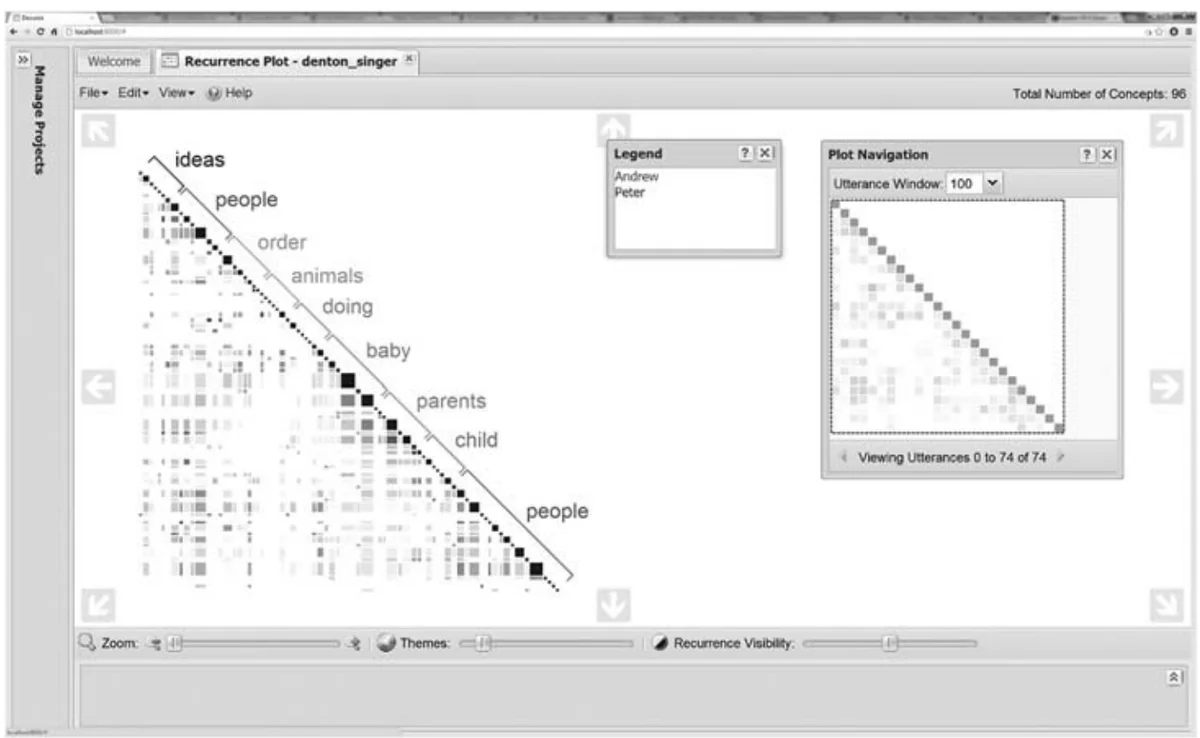
Patterns at several time scales at once. Discursis shows topic use at several time scales simultaneously, from turn by turn to the whole conversation. Earlier studies by Angus and colleagues of talk shows, medical consultations, cockpit recordings and phone calls used it to find topic convergence between speakers and, for example: #
“whole conversation call-back behaviours (where early mentioned topics were revisited much later in the conversation)”
The visual becomes part of reasoning. In social research, visuals have mostly served as end-stage output for readers. Visual-first tools bring them into reasoning and decision-making about the data. Our assessment: #
“tools such as Leximancer and Discursis are powerful techniques for developing evidence-based global analyses that would otherwise tax the cognitive abilities of an analyst”
Questions this paper answers
- When does a visual tool help more than reading the text yourself?
- When the data are too large to hold in mind. Visual text analytics give a global view of a whole data-set that would otherwise tax an analyst. They then let the analyst drill down to the original passages, so overview and close reading support each other. (See §1, p. 3; §4, p. 6.)
- Can visual text analysis test a theory, or only explore data?
- Both. Earlier studies used Discursis (a tool that maps which turns of a conversation share topics) on talk shows, medical consultations, cockpit recordings and phone calls. Its visuals helped analysts confirm theory-driven hypotheses about how speakers reuse topics, and discover unexpected patterns of interaction. (See §3, p. 5.)
- Is automated coding more trustworthy than hand-coding?
- It is more reproducible, because a concept list generated statistically from the text itself does not depend on who codes it. Hand-made code lists, by contrast, need reliability and validity checks. Automated coding may also surface unusual relationships. The researcher still interprets and adjusts what the software produces. (See §1, p. 3; §2, p. 3.)
- Can software show how a conversation develops over time?
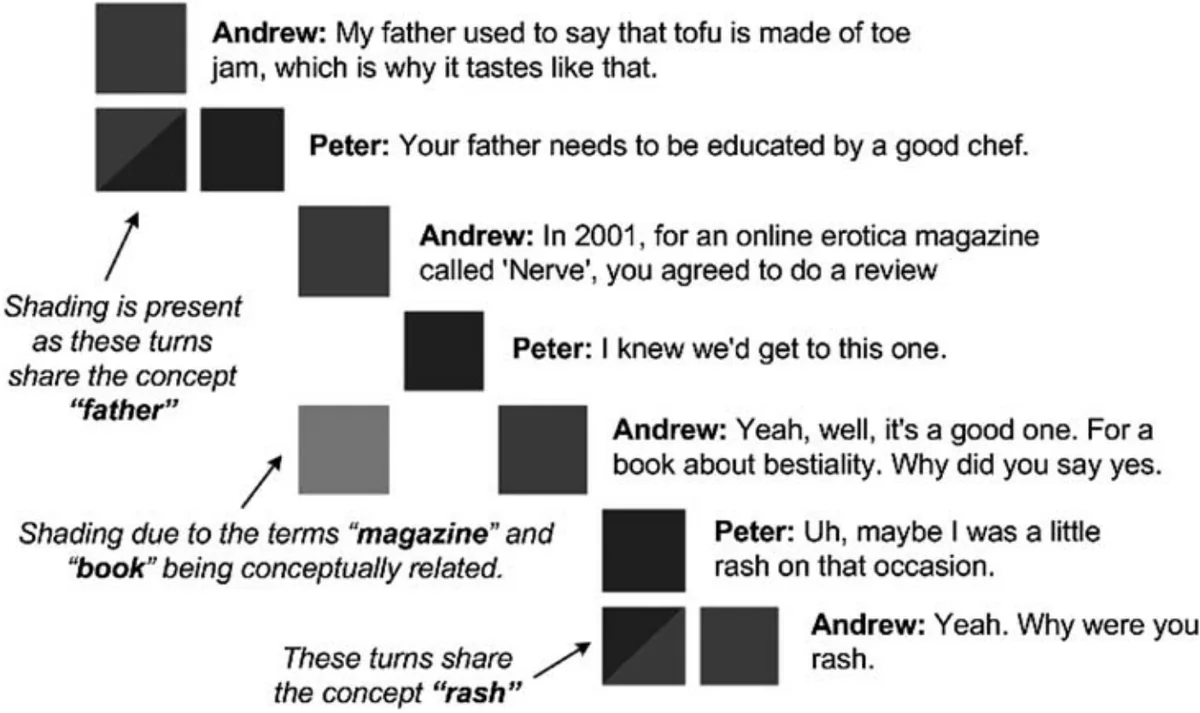
- Yes. One such tool, Discursis, lays out every turn of a conversation and shades where turns share concepts. An analyst can then see at a glance who speaks when, where speakers converge on topics, and where early topics are revisited much later. (See Abstract, p. 2; §3, p. 5.)
Contributions and implications
- Visual text analytics should be extended to more theoretical frameworks, as a new operationalisation of evidentiary procedures.
- A library or taxonomy of visual motifs could help researchers make visual sense of their data and re-evaluate new data rapidly.
- The tools support rather than replace human analysts.
techniques such as Leximancer and Discursis are not designed to replace the role of the human analyst in the social sciences
(§4, p. 6)
Limitations
- Visual-first social research methodology is still in its infancy, and the workflows it needs are an ongoing research agenda.
Social research methodology that uses visual-first analytic methods is still in its infancy
(§4, p. 6) - As with many new tools, they introduce new requirements into the research workflow.
›Concepts
- Visual text analytics
- The merging of text analysis and information visualisation.
techniques that visually model text data for interpretation by a researcher
(§1, p. 2) - CAQDAS
- Established tools such as NVivo, Atlas.ti and MAXQDA:
since the 1990s computer-aided qualitative discourse analysis software (CAQDAS) applications have provided the means for semi-automated analysis of conversation, interview, mass media and new media data
(§1, p. 2) - Concept map (Leximancer)
- An automatically generated, interactive map of the main concepts and themes in a text. How it is built:
Leximancer uses word occurrence and co-occurrence counts to extract major thematic and conceptual content directly from an input text.
(§2, p. 3) - Discursis plot
- Discursis's visualisation, for text with a temporal structure such as a conversation:
generates an interactive visual representation of the input text by linking similar temporal units
(§3, p. 4)
Figures
How to cite
Daniel Angus, Sean Rintel, and Janet Wiles. 2013. Making sense of big text: A visual-first approach for analysing text data using Leximancer and Discursis. International Journal of Social Research Methodology 16 (3), 261-267. https://doi.org/10.1080/13645579.2013.774186
This brief was prepared with AI assistance and published by Sean Rintel. It is not the authors' published text. Page numbers refer to this PDF.