Research brief
Takeaway: Meetings people rate effective are ones where they felt included and took part. So an AI dashboard reviewed after video meetings can make attendees aware of who spoke, when and about what. Speaking turns and participation proved most useful, while facial sentiment readings were rated lower and doubted.
Why this matters
- What was known
- Video meetings limit social cues. Feedback systems can shape group behaviour, but real-time feedback can distract. Prior work also ties effectiveness to inclusion:
online meeting effectiveness correlates with meeting inclusiveness, participation, and comfort in contributing
(§1, p. 1) - What this paper adds
- Rather than real-time feedback, which can distract, we design feedback for after the meeting. We do this with real work teams over two design iterations, using AI-sensed recordings of their own meetings, and work out with them which signals to share and which to keep private.
We developed MeetingCoach, an AI-driven dashboard that provides both contextual and actionable insights based on meeting behaviors.
(§1, p. 2) - Who it matters to
- Designers of video-conferencing platforms and meeting feedback systems, for whom affective signals remain an untapped design space:
no major commercial platform leverages affective signals to provide actionable meeting metrics
(§6, p. 11)
Research questions
- (1) What aspects of meetings do videoconferencing attendees need help with?
- (2) How can we leverage AI systems to make video-conferencing meetings more inclusive and effective?
- (3) How should AI-extracted meeting features (including content, behavioral measurements, and sentiment) be categorized and visualized in a feedback dashboard?
- (4) What concerns exist regarding data privacy and accuracy for such systems?
Method and data
- Design
- Two-phase iterative, human-centred design study: a requirement analysis survey, then a 4-week longitudinal study with two design iterations (a wireframe dashboard evaluated by survey, then an interactive dashboard built from AI-sensed real meeting data, evaluated by interviews and survey).
- Prototype
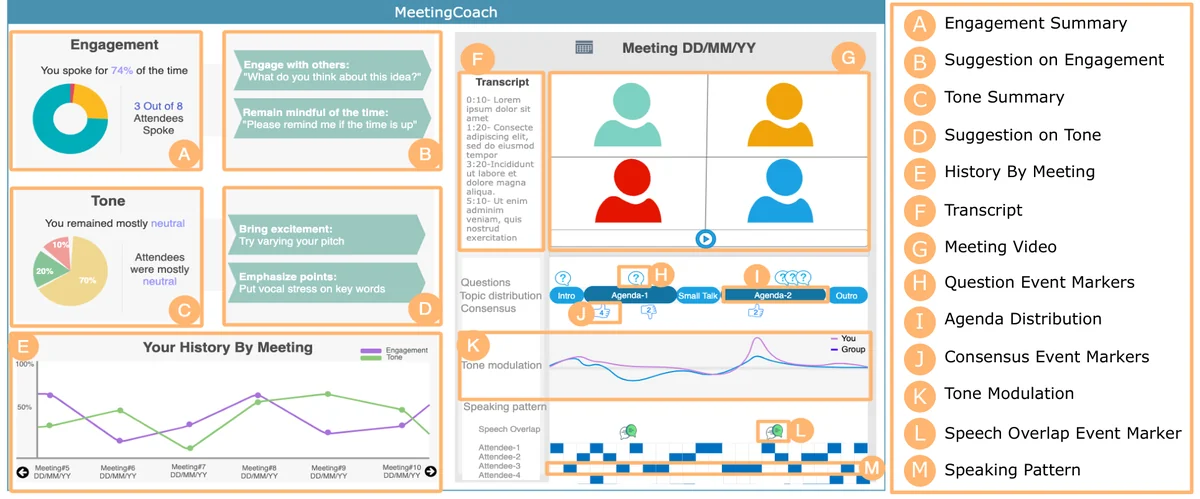
- MeetingCoach, a web dashboard personalised for each attendee and built from recordings of their own team's Microsoft Teams meetings. A custom bot records each attendee's audio and video separately. AI pipelines then transcribe speech and detect questions, measure who spoke and for how long, detect head nods and shakes to mark moments when two or more people agreed or disagreed ('consensus'), and classify facial expressions as positive, neutral or negative sentiment. After the meeting the attendee sees, on the left, summaries of their participation and sentiment with suggestions (for example, to check everyone is on the same page) and their history across meetings. On the right, timelines of speaking turns, questions, consensus and sentiment, where clicking an event plays that moment of the meeting video beside the transcript. Meeting content and participation are shared with the team. Personal sentiment and suggestions are private. It is built on Microsoft speech, face and emotion recognition services. An earlier, non-interactive wireframe with mocked data was evaluated first. There was no comparison condition.
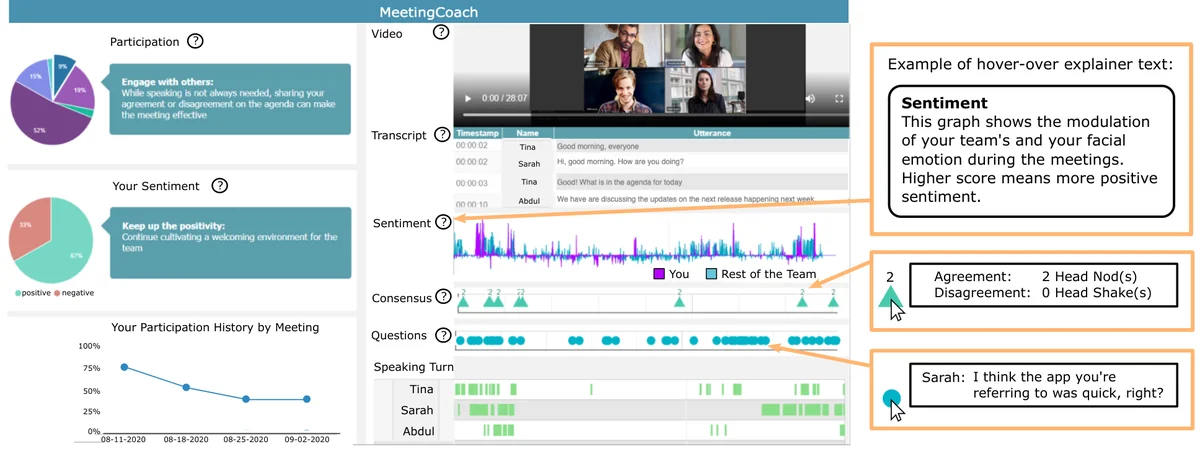
Figure 6: A screenshot of our interactive web dashboard on the left. Hover-over functionalities are shown on the right. From the paper, Figure 6, p. 8. - Setting
- Fully remote recurring team meetings on Microsoft Teams at a large technology company during COVID-19 work-from-home requirements.
- Participants / data
- Survey: 120 information workers. Longitudinal study: 8 teams (49 participants) and 28 recorded meetings, 16 wireframe evaluations, and interactive dashboard evaluated through surveys (N=23) and interviews (N=9).
- Duration
- Four weeks of weekly meetings. Wireframe evaluated at the end of week 2, interactive dashboard at the end of the study.
- Analysis
- Chi-square tests and thematic analysis of survey responses. Descriptive ratings of the wireframe and the interactive dashboard. Semi-structured think-aloud interviews.
Findings
Inclusive meetings felt effective. We surveyed information workers at a large technology company, all meeting by video during COVID-19. Recalling their latest effective and ineffective meetings, people reported full participation and feeling included significantly more often in the effective ones. #
(§3.3, p. 4)Social cues are harder to read online. Most survey respondents rated understanding social signals as very important, and many said these signals were harder to read in online meetings than face to face, even with audio and video. Nine in ten wanted a tool that gave feedback after the meeting. #
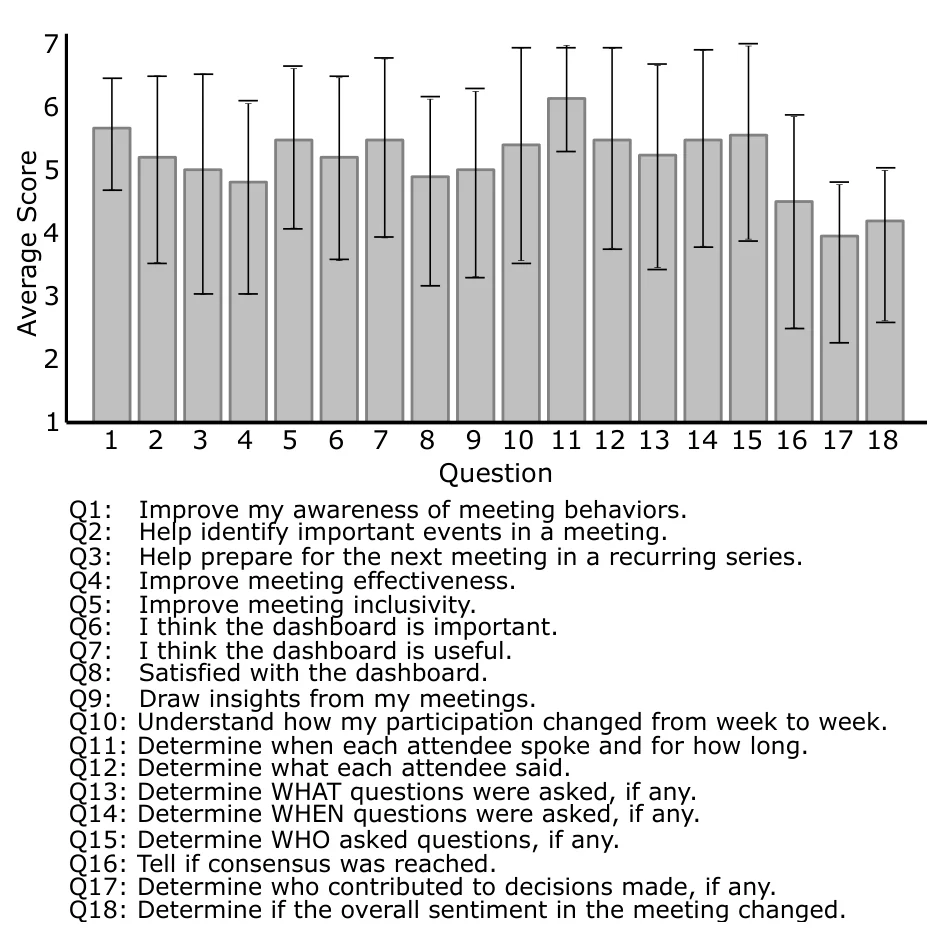
(§3.3, p. 4)Reviewing raised awareness. Team members who reviewed a dashboard built from their own team's recorded meetings agreed it would improve their awareness of meeting behaviour, and rated it likely to improve inclusivity, less so effectiveness. Several saw it as a tool for occasional reflection: #
“I would probably not use this for every meeting, but I would use it to reflect to meetings that I want to reflect on”
Who spoke beat how they felt. Among the dashboard's features, the meeting video, speaking turns and participation were rated most useful. Facial-sentiment features were rated lower, because workplace meetings stayed mostly neutral and participants doubted the readings. #
“People just might be serious in the meeting, which might translate as negative, and that would not be appropriate.”
Give one nudge, not just data. Participants wanted short actionable suggestions, not just data to study. They wanted suggestions as a reminder just before the next meeting, and highlights of events such as questions to review afterwards. #
“At the end of a meeting you don't want to sit and study data. You want one nudge.”
Emotion sensing felt intrusive. Before the dashboard was built, survey respondents did not want emotional sentiment included, doubting how accurately AI computes it and worrying about privacy, usefulness and subjectivity. #
“I think it would be overly intrusive to have this data from other participants”
Questions this paper answers
- Can an AI meeting dashboard help teams run better video meetings?
- It can raise awareness. Workplace teams who reviewed personalised dashboards of their own recorded meetings agreed it would improve their awareness of meeting behaviour and rated it likely to improve inclusivity. Ratings for effectiveness were lower. Each person used it once, so long-term effects are untested. (See §4.3, p. 10.)
- Do people want AI to analyse their emotions in work meetings?
- Mostly not. Survey respondents doubted the accuracy of AI sentiment readings and found them intrusive. People who saw sentiment in their own dashboards rated it less useful, because workplace meetings were mostly neutral and seriousness might be misread as negativity. (See §4.3, p. 9; §3.3, p. 4.)
- What goes with video meetings that feel effective?
- Inclusion goes with them. Among 120 information workers at a large technology company, all working from home, full participation and feeling included were both significantly more common in meetings they rated effective. Many also found the social signals that help people take part harder to read online. (See §3.3, p. 4; §3.3, p. 4.)
- Should AI feedback about a meeting be shared with the whole team?
- It depends on the signal. People were comfortable sharing what was said, such as transcripts and questions, and how much each person spoke, but wanted personal behavioural signals, especially emotional sentiment, kept to themselves. (See §4.3, p. 9; §3.3, p. 4.)
Quantitative results
| Measure | Result | Where |
|---|---|---|
| Full participation more prevalent in effective than ineffective meetings (survey) | χ2 (1, N = 231) = 34.89, p < 0.001 | §3.3, p. 4 |
| Feeling included more prevalent in effective than ineffective meetings (survey) | χ2 (1, N = 240) = 21.78, p < 0.001 | §3.3, p. 4 |
| Social signals very important in meetings; harder to understand online | 78% very important; 55% more difficult online | §3.3, p. 4 |
| Interactive dashboard: would improve meeting awareness (1-7 scale) | M = 5.45, SD = 0.86 | §4.3, p. 9 |
| Interactive dashboard: would improve effectiveness / inclusivity (1-7 scale) | effectiveness M = 4.45, SD = 1.47; inclusivity M = 5.23, SD = 1.23 | §4.3, p. 9 |
| Could tell when each attendee spoke and for how long (turn-taking feature) | M = 6.00, SD = 0.82 | §4.3, p. 9 |
| Comfort with participation information being shared (1-5 scale) | M = 4.41, SD = 0.67 | §4.3, p. 9 |
| Comfort with sentiment information being private (1-5 scale) | M = 3.36, SD = 1.26 | §4.3, p. 10 |
Contributions and implications
- Feedback systems with many features should provide actionable suggestions. (§5.1, p. 11)
- Tailor feedback to timing, with reminders before meetings and highlights after them.
- Aggregate feedback across a series of meetings to support training and longer-term habits.
- Use multi-modal signals (for example head gestures plus language) for more accurate, more trusted features. (§5.1, p. 11)
- Address consent, coercion and the risk of use in performance evaluation before deploying such systems.
Future research should study how to appropriately capture consent and communicate the role of the feedback tool.
(§5, p. 10)
Limitations
- All meetings came from one large technology company during COVID-19 work-from-home restrictions. (§5.2, p. 11)
- Teams were recurring and familiar, which may have affected perceived effectiveness and comfort with sharing.
- All participants were remote. Hybrid meetings would add complexity. Recording may have caused a Hawthorne effect.
- Participants interacted with the dashboard only once. (§5.2, p. 11)
›Concepts
- Behavioral and topical features
- How the dashboard's features were grouped:
we categorized the feedback features into two classes: (1) behavioral (e.g., participation, sentiment), and (2) topical (e.g., transcription, questions about the meeting content)
(§4.2, p. 5) - Summarized, suggestive and temporal views
- Three ways the dashboard presents features: quick averages, actionable tips, and a clickable timeline of meeting events.
(1) summarized: showed a quick snippet of the average measurement of a feature; (2) suggestive: provided actionable suggestions related to the individual' s feature outcomes; and (3) temporal
(§4.2, p. 5) - Shared and private features
- Topical features were shared with attendees. Most behavioural features, especially sentiment, were kept private to the individual.
participants felt more comfortable sharing the topical contents with others, whereas they wanted most behavioral features to be kept private
(§4.2, p. 5) - Consensus
- A group-agreement signal, detected from video:
Consensus was measured whenever two or more attendees asserted either head nod or head shake signals in the synchronized timeline.
(§4.3, p. 9)
Figures
How to cite
Samiha Samrose, Daniel McDuff, Robert Sim, Jina Suh, Kael Rowan, Javier Hernandez, Sean Rintel, Kevin Moynihan, and Mary Czerwinski. 2021. MeetingCoach: An Intelligent Dashboard for Supporting Effective and Inclusive Meetings. CHI 2021. https://doi.org/10.1145/3411764.3445615
This brief was prepared with AI assistance and published by Sean Rintel. It is not the authors' published text. Page numbers refer to this PDF.