Research brief
Takeaway: Brief goal-reflection surveys can build meeting intentionality whether they come before and after meetings or only after. Either way, people reported clearer, better-communicated goals, and most felt their meetings improved, perhaps because repeated reflection acted as micro-training. Adding pre-meeting prompts brought no further measurable gain in rated effectiveness.
Why this matters
- What was known
- Meetings are widely seen as purposeless, and reflection tools look promising, but most evidence comes from small studies outside normal work.
much of the research is conducted with limited ecological validity, relying on out-of-context reflection, unfamiliar interfaces, or small samples
(§1, p. 1) - What this paper adds
- A large, preregistered field experiment with a control group, run inside people's everyday collaboration tool, plus mixed-methods evidence on how people experienced it.
There is also a lack of research measuring the impacts of prospective reflection, at a large scale, compared against a control condition.
(§3, p. 3) - Who it matters to
- People building calendars, collaboration platforms and AI meeting assistants, and researchers who evaluate reflection and nudging at work.
Research questions
- RQ1. Does asking workers to reflect on their goals for upcoming workplace meetings impact meeting effectiveness and engagement and upstream aspects like self-awareness and behaviour change?
- RQ2. What are workers' experiences of goal-oriented reflection for meetings, attitudes towards the intervention, and barriers to reflection and meeting intentionality?
- RQ3. What are the implications for designing technological support for meeting reflection and intentionality?
Method and data
- Design
- Preregistered (AsPredicted #194719) two-week randomised field experiment. Treatment: pre-meeting goal-reflection surveys plus post-meeting effectiveness surveys. Control: post-meeting surveys only.
- Prototype
- The Meeting Survey app, a Microsoft Teams bot connected to each participant's calendar. For eligible video meetings (under 3 hours, at least two attendees, accepted, and with at least 10 minutes free beforehand) it sent a chat message 5 minutes before the start asking what success would look like for the meeting. People ticked goals phrased as success criteria, such as 'Decision is made' or 'Everyone is up to date', or wrote their own. They also rated how clearly the goal had been communicated and how effective they expected the meeting to be. Two minutes after the scheduled end it sent a short survey asking how effective the meeting had been, on a six-point scale. It was built with the Bot Framework and the Microsoft Graph calendar interface. The control group received only the post-meeting survey.
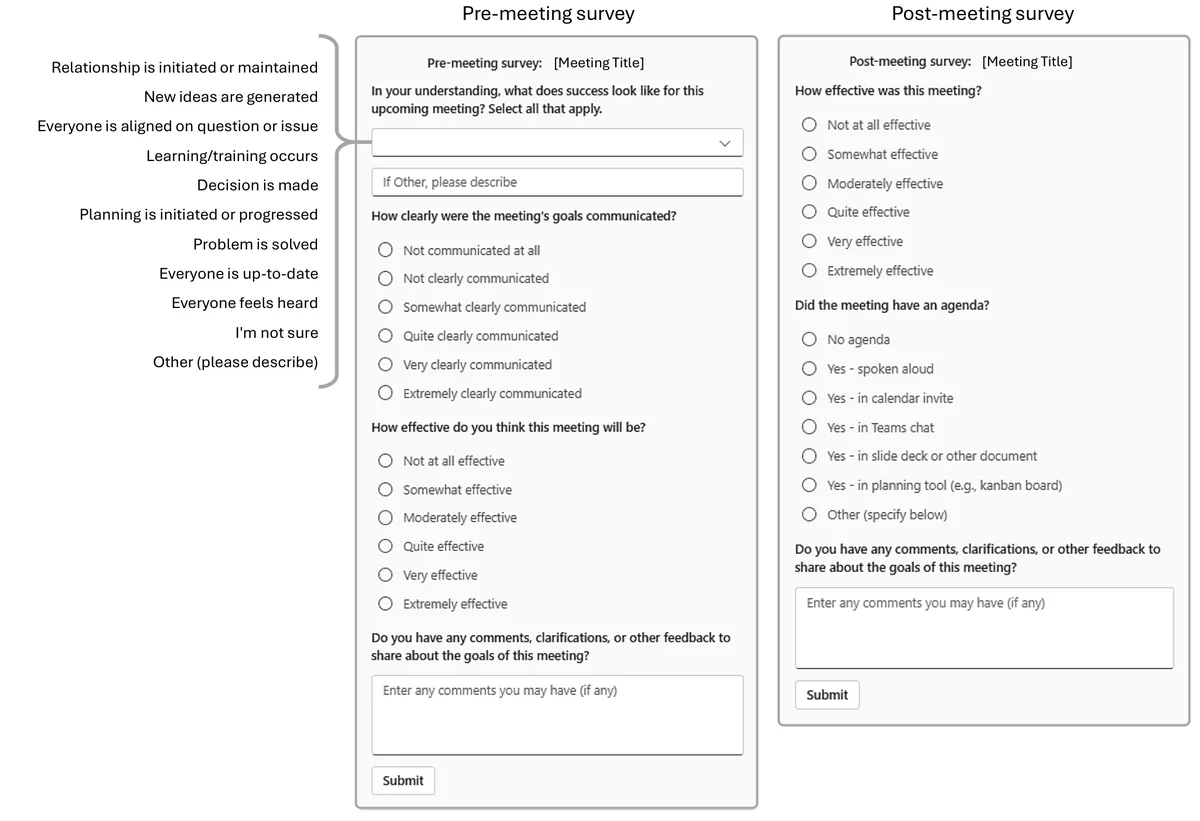
Figure 1: Pre- and post- meeting surveys as they appeared in chat threads via our Meeting Survey application. In the pre-meeting survey, treatment group participants could select multiple goals from 11 options, as well as write in their own goals. From the paper, Figure 1, p. 5. - Setting
- A global technology company, inside participants' everyday collaboration platform (Microsoft Teams).
- Participants / data
- 361 employees (treatment = 163, control = 198) and 7196 meetings.
- Duration
- Two weeks (10 working days), with onboarding and debriefing surveys.
- Analysis
- Intention-to-treat mixed-effects linear regression on per-meeting effectiveness ratings with multiple imputation. Difference-in-differences models for goal clarity and communication. Exploratory CACE analysis. GPT-4o-assisted labelling (manually reviewed) and reflexive thematic analysis of open-text responses.
Findings
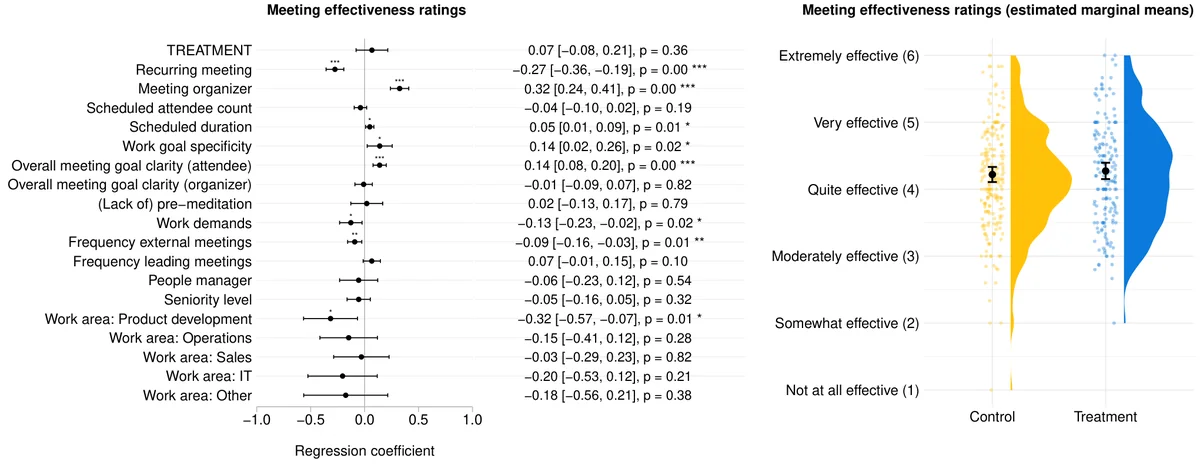
No measurable gain in effectiveness. Across 7196 meetings at a global technology company, employees who got a short goal-reflection survey five minutes before each meeting did not rate their meetings significantly more effective than colleagues who only rated meetings afterwards. This held even when only meetings where they did the survey were counted. #
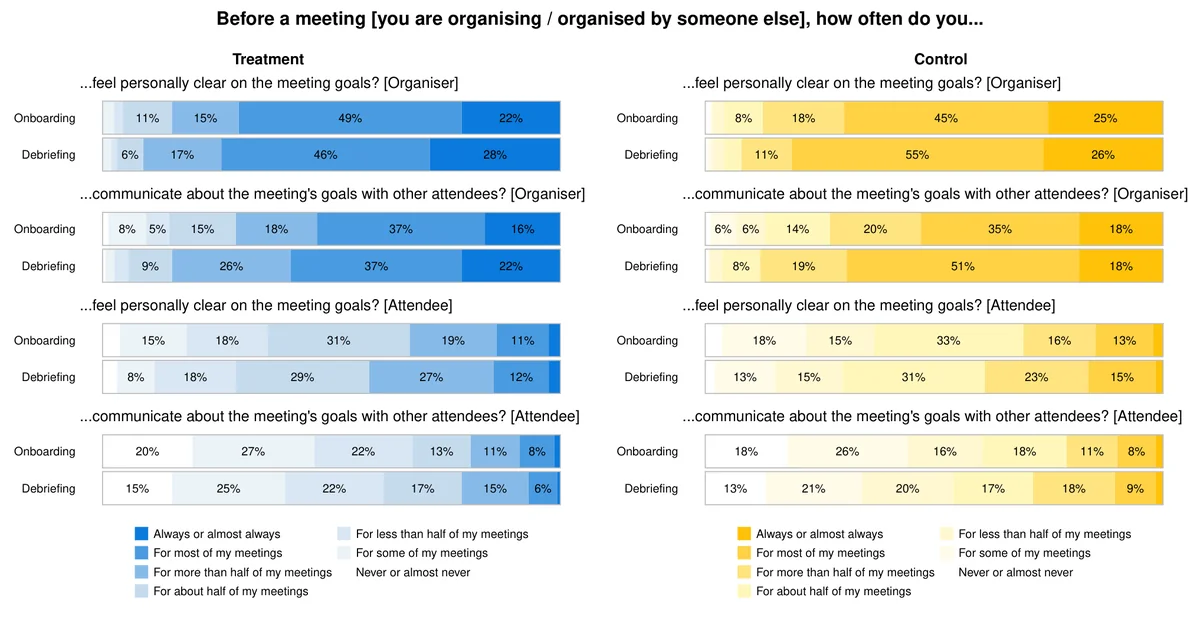
(§5.2.1, p. 8)Everyone got clearer about goals. Comparing the start and end of the two weeks, employees in both groups reported feeling clearer about meeting goals and communicating them more often, with no significant difference between groups. Participants described a reflective habit building up over the study. #
“I feel that as the study progressed I was more inclined to think about meeting goals/agenda etc. before and after.”
Rating meetings may itself have been a nudge. Most participants in both groups described new awareness or new habits, such as noticing that a goal clear to the organiser was not clear to others. The post-meeting ratings, meant only as measurement, seem to have prompted reflection too. #
“I started to notice that for meetings I organised usually goal is clear for me, but I don't make sure it's clear for everyone else.”
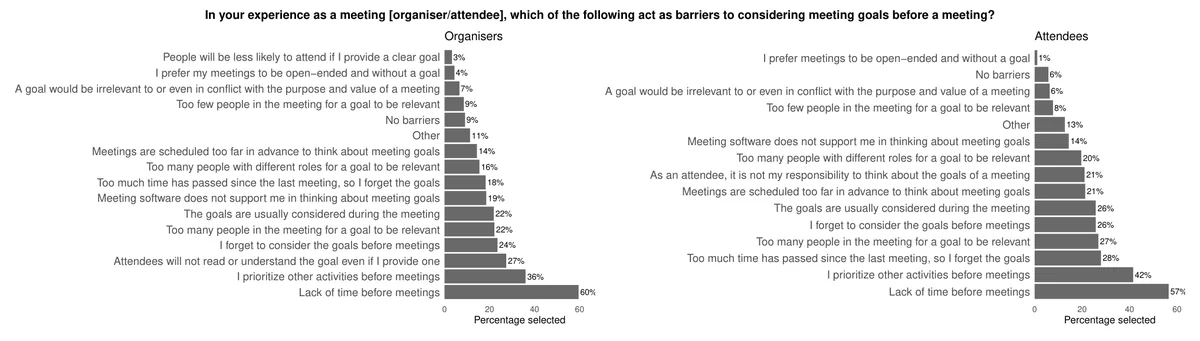
Five minutes before was often too late. For many participants, pre-meeting prompts arrived too late to act on, and prompts for every meeting caused survey fatigue. Lack of time before meetings was the most common barrier to thinking about goals, for organisers and attendees alike. #
“When the survey is sent 5 minutes before the meeting starts, we are already way past time when I would change anything about my approach.”
Organisers and attendees wait on each other. Attendees often felt unable to change meetings they had not organised, and organisers assumed attendees would not read the goals anyway. This loop discourages preparation on both sides. #
“21% of all participants felt that, as an attendee, it was not their "responsibility to think about the goals of a meeting"”
Goals tied the work together. People in both groups said they added goals to invitations, declined or reshaped meetings, engaged more actively during them, and saw stated goals as useful input for AI meeting tools. #
“I was more cognizant of being an active agenda engager rather than a passive meeting attendee.”
Questions this paper answers
- Do prompts to think about goals before a meeting make it more effective?
- Not measurably, in a large workplace field experiment. A short goal survey five minutes before each meeting did not raise how effective people rated their meetings. It possibly came too late to act on, and effectiveness depends on all attendees, not only the one who reflected. (See §5.2.1, p. 8.)
- Does reflecting on meeting goals change how people work?
- It seems to build meeting intentionality, though we cannot prove it. Being asked regularly to think about meeting goals, even after the fact, coincided with people reporting clearer goals, putting them in invitations and questioning meetings. Without a comparison group that got no surveys, other influences cannot be ruled out. (See §6.2.1, p. 13; §6.2.2, p. 13; §6.2.3, p. 14.)
- Why don't people think about meeting goals in advance?
- Lack of time before meetings was the most common barrier for both organisers and attendees. Attendees also often felt unable to change meetings, or that goals were not their responsibility, while organisers assumed attendees would not read them. (See §6.1.2, p. 11; §6.1.5, p. 12.)
- Can measuring a behaviour change it?
- It may. When 361 tech company employees were randomly assigned pre-meeting goal prompts for two weeks, post-meeting effectiveness ratings were meant only as measurement. Yet they seem to have prompted goal reflection even without prompts, making the prompts' effect harder to detect. Reflection research is especially prone to this. (See §6.2.1, p. 13; §6.2.2, p. 13.)
Quantitative results
| Measure | Result | Where |
|---|---|---|
| Sample | 361 participants (treatment = 163, control = 198); 7196 meetings | §4.2, p. 4 |
| Treatment effect on per-meeting effectiveness (intention to treat) | p = 0.36 (not significant) | §5.2.1, p. 8 |
| Treatment effect for compliant meetings (CACE, exploratory) | p = 0.6 (not significant) | §5.2.1, p. 8 |
| Said study participation increased meeting effectiveness | 57% treatment vs 52% control; p = 0.13 (not significant) | §5.2.2, p. 8 |
| Said study participation increased engagement | 43% treatment vs 34% control; p = 0.05 (not significant) | §5.2.2, p. 8 |
| Goal clarity and communication: time effect (both groups) | all p-values < 0.05; treatment × time all p-values > 0.1 | §5.2.3, p. 8 |
| Reported awareness or behaviour change (open text) | 57% treatment, 60% control; χ2 = 1.97, p = 0.37 between groups | §6, p. 10 |
| Interest in a future pre-meeting prompt to think about meeting goals: overall, and treatment vs control | Over two-thirds 'quite', 'very' or 'extremely' interested, but treatment less interested than control, p = 0.01 | §5.2.4, p. 9 |
| Post-meeting surveys completed more than 15 minutes after the meeting | 55% control, 60% treatment | §5.1, p. 7 |
| Answering as organisers, saw 'attendees will not read or understand the goal' as a barrier to considering goals | 27% | §6.1.5, p. 12 |
Contributions and implications
- Support habitual goal reflection without overload by targeting novel, high-stakes or ambiguous meetings rather than prompting for every meeting.
Target reflection for novel, high-stakes, or ambiguous meetings.
(Table 5, p. 17) - Embed goal reflection in the rhythms and spaces of work, especially scheduling tools for organisers, and batch reflection at natural planning points.
- Make reflection actionable, so that articulated goals feed invitations, pre-reads, AI facilitation and recaps.
we argue that current AI systems are limited in inferring intent; explicit human goal articulation remains a critical prerequisite
(§7.2.3, p. 17) - Support reciprocal reflection between organisers and attendees to break corrosive loops of low preparation.
- Lightweight, workflow-embedded nudges may act as micro-training for meeting intentionality.
Limitations
- No truly passive control group, so the causal effect of the post-meeting surveys cannot be isolated.
we cannot exclude the potential influence of confounding external variables
(§7.1.1, p. 15) - All outcomes are self-reported and subject to measurement reactivity and social desirability.
- Many surveys were completed late or not at all, especially in the treatment group, which reduces statistical power.
- The quick survey format captured little evidence of reflection quality.
›Concepts
- Meeting intentionality
- Thinking ahead explicitly about meeting goals. It depends on organisers, attendees and other collaborators working together.
Meeting intentionality is inherently interdependent, requiring coordinated effort between meeting organisers, attendees, and other collaborators.
(§7.2.4, p. 17) - Nudge plus
- A nudge that adds a moment of reflection rather than relying only on fast, habitual responses.
The more recent 'nudge plus' involves incorporating aspects of reflection, i.e., System 2 thinking, into nudges
(§2.2, p. 2) - Workplace reflection
- Reflection shaped by organisational context.
where competing priorities, time pressure, and social dynamics shape when and how reflection occurs
(§2.2, p. 2) - Measurement reactivity
- When measuring a behaviour changes it. Here, the post-meeting effectiveness surveys may have acted as a reflection prompt for the control group too.
What was intended for measurement thus potentially became an active reflection prompt
(§7.1.2, p. 15)
Figures
How to cite
Lev Tankelevitch, Ava Elizabeth Scott, Nagaravind Challakere, Payod Panda, and Sean Rintel. 2026. Nudging Attention to Workplace Meeting Goals: A Large-Scale, Preregistered Field Experiment. CHI 2026. https://doi.org/10.1145/3772318.3791199
This brief was prepared with AI assistance and published by Sean Rintel. It is not the authors' published text. Page numbers refer to this PDF.